Radial Creative Diagrams
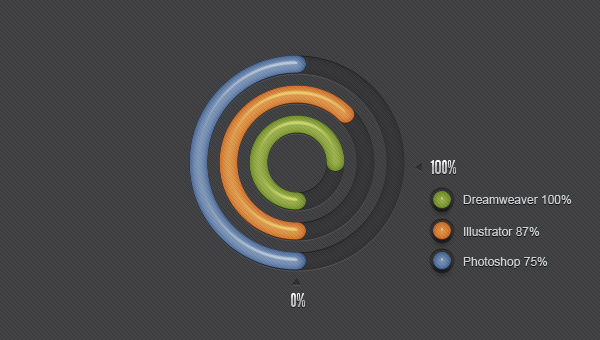
When there are a number of items or categories to compare, then Radial Creative Diagrams would be one of the best tools to present a bar diagram by moving the layer mask and the web elements. It presents the data in a clear manner and is also quite easy to interpret the classifications.
The data is displayed radially and allows the users to compare the skills or items that are displayed. This tool enables us to arrive at quick conclusions regarding any particular data or information. The length of the diagram usually represents the figures for the required data.
Since the Radial Creative Diagrams are quite easy to create and use, these are popularly used by many web designers. You can easily download this tool to your website since it is also quite simple to understand and use the options available.
There are two types of data that can be used for displaying in these diagrams – the nominal and the ordinal data.
Skills elements used in Radial creative Diagrams
There are some o basic skill elements and skill levels that can be used in the radial diagrams:
- Guiding and monitoring reactions
- For maintenance as well as restoring the workflow
- Interlinking activities with others
- Sensing situations and contexts
- Distributing and combining own activities
- Bargaining or negotiating boundaries
- Connecting across cultures
- Judging impacts
- Helping to communicate non-verbally and verbally
More from Misc
-
 September 12, 2012
iPhone 5 Design
-
 September 12, 2012
Nice Fat Ribbon
-
 September 12, 2012
Retro Badges Vintage
-
 October 6, 2012
Mini Price Table
-
 September 19, 2012
Settings
-
 September 18, 2013
Perspective iPhone 5C Psd Vector Mockup