Pretty Little Pie Chart
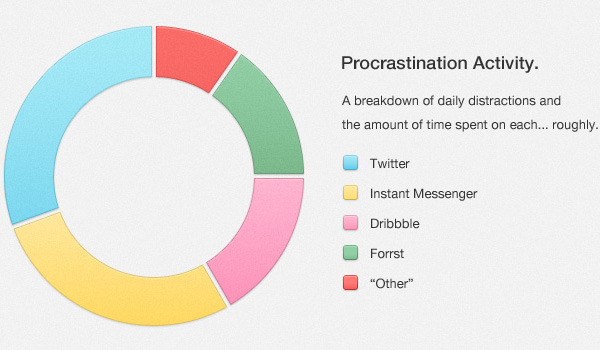
You can improve the design and feel of your website by including the best graphical representations of data wherever required. And for this, you can resort to plots, grids, graphs and charts. Of all these, a chart can represent the segregation of factual data in the most effective and compelling manner. You can construct dynamic charts with libraries.
However, this requires additional time and effort. And as a web designer you may not afford it because there are many other elements also which need to be handled. Therefore, the easy solution is to use the ones that are available online. Nowadays, various styles of charts are in trend and Pretty Little Pie Chart (PSD) is widely used of all.
Why Use Pretty Little Pie Chart (PSD)?
This pie chart PSD is recommended for use for various reasons:
- It can present different information and data in a neat manner.
- It can give the breakdown of user’s activity and the time they spent on different platforms such as Twitter, Forrst, Dribbble and so on through a wide range of color combinations.
- It is easy-to-download and easy-to-use.
A large number of designers are using this chart because it is created on PSD file format. PSD files are known for their advanced techniques and styles. These are time-saving also. If you want, you can incorporate the pie chart PSD into your web design and edit it according to your needs and requirements.
More from Misc
-
 September 18, 2013
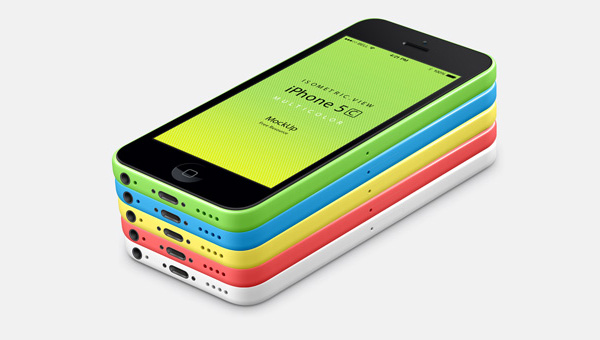
Perspective iPhone 5C Psd Vector Mockup
-
 September 11, 2012
Dial Version 3
-
 September 12, 2012
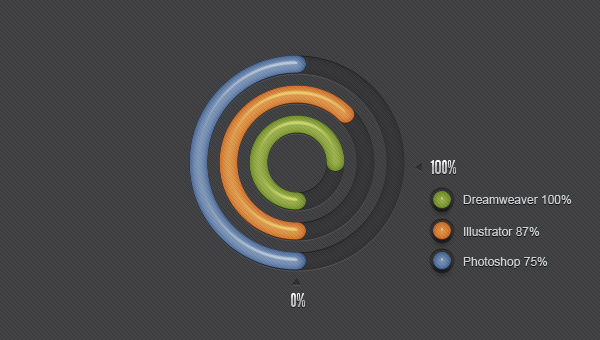
Radial Creative Diagrams
-
 September 10, 2014
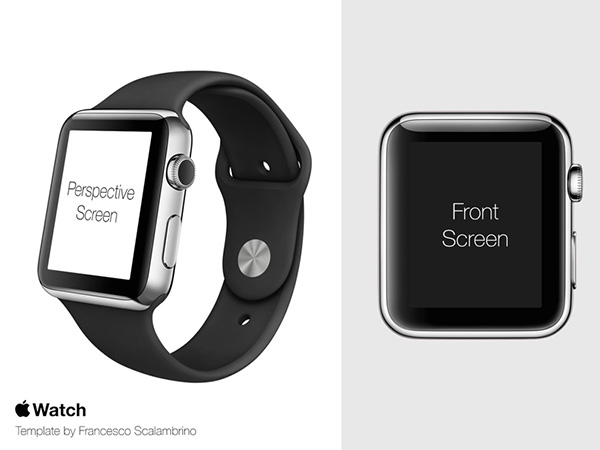
Apple Watch Free Template PSD
-
 December 29, 2012
Newsletter Pop-Up
-
 October 29, 2013
Nexus 5 Vector (.Ai)